12 min read
.jpg?width=682&height=399&name=My%20project%20(27).jpg)

When running a business, one of the most common pieces of advice you'll encounter is being told that you should know your numbers.
|
Key Takeaways
|
Often, though, it's not always clear which numbers you should know, how to read them, and what actionable information you can actually glean from your company's financial data.
The GrowthForce Company Scorecard, however, makes "knowing your numbers" easy.
By following the six KPI charts included on your scorecard, you'll be able to see the relationship between people and profitability in your company. These quickly "consumable" charts are designed to make it easy to understand, measure, and compare some of the most important drivers of your business.

Monthly Management Reports: Why These Six Charts?
The six charts that make up your One-Page Scorecard provide a quick and easy monthly look at the relationship between people and profitability in your company.
There are many different reports, ratios, and KPIs that you can use to understand your business. In fact, data can be collected on every aspect of your business and analyzed in nearly infinite ways. Too much data, however, can be overwhelming and quickly become meaningless. Understanding which drivers have the greatest impact on your business and knowing how to analyze the financial data related to these drivers will help you optimize performance and productivity to maximize profit.
Our One-Page Scorecard includes the following charts:
- Revenue per Hour
- Gross Revenue
- Labor Cost per Employee
- Gross Profit %
- ROI on Total Labor Cost
- Net Income
The six reports contained in the One-Page Scorecard can help any business that makes money on other people's time (service-based businesses in particular).
So, why have we chosen to include these six charts? These charts work together to reveal how people impact profits and how the results impact your human capital management strategy. We recommend you look at trends in these charts to measure and compare your company's performance by benchmarking against your budget and company history as well as your peers and competition.
Monthly Financial Management: How to Use Your One-Page Scorecard
The six charts are arranged in a specific order on the One-Page Scorecard. The left column shows people metrics, and the right column shows company metrics. The top row represents revenue, the middle row represents gross profit, and the bottom row represents net income. Look at your scorecard each month, reading across each row to track how your people are driving profits in your business.
Revenue per Hour
Revenue Divided by Total Hours Paid
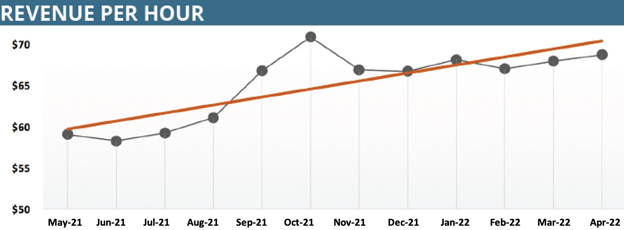
"Revenue per hour shows how well you are managing the productivity and resulting profitability of your people."
What Does It Tell Me?
Revenue per hour is the dollar amount of revenue earned for every hour you paid people to work. Total Hours Paid includes all salaried and hourly employees in addition to both direct and overhead staff. Use 40 hours to get total hours paid for salaried and part-time FTEs.
Revenue per hour is one of the most important metrics to watch when you make money on other people's time. It shows how well you manage the productivity and resulting profitability of your people. The hidden costs of turnover, non-billable time, and inefficient time are summarized in one number.
What Should I Look at?
- How does your revenue per hour compare to what you thought it should be?
- What’s your trend? Are you directionally going up, staying the same, or shrinking?
- How does this month compare to the highs and lows of the past year? Is this month a minor blip or change in the business model?
- How does revenue per hour compare to changes in personnel? Did turnover or new hires hurt you?
What Actions to Take
If Revenue Per Hour is growing, recognize and reward your best people and teams.
- Study the behaviors of your best-performing people. Recruit to replicate those traits.
If rates are shrinking, look at pricing and make sure your bids include all labor costs on a job.
- Review the impact on productivity from changes in personnel.
- If people left, ask “Why?” in an exit interview and learn from their responses. Consider exit interviews to be like free employee management consulting.
- If you added new staff, review how you onboard new employees. Study how long it takes a new person to be fully productive.
- Drill down to revenue per hour by team, department, or another type of work group structure. Study the differences between the best and worst supervisors, training, client longevity, incentive comp, etc. Create a personal development plan to move your worst up or out.
Gross Revenue
Income Earned From All Sources
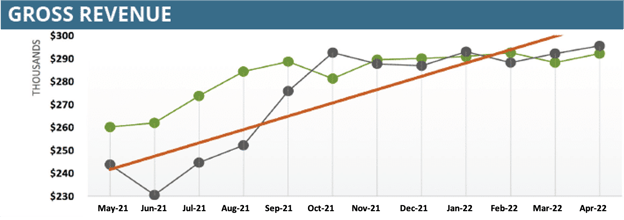
"Gross revenue shows the total dollar amount of money earned. It's the top line."
What Does It Tell Me?
Gross revenue is the total amount of money earned. It’s the top line, before expenses, deductions, allowances, etc. It shows the ability of a business to sell goods or services but not necessarily the ability to make a profit.
The gross revenue metric is an accurate indicator for service businesses where there isn’t much difference between gross and net sales. The trend line tells you whether your billings are going up, shrinking, or staying the same.
What Should I Look at?
- What does the orange trend line tell you? Are you directionally going up, down, or shrinking?
- How does revenue compare to what you thought it was going to be (your budget)?
- How does this month compare to the highs and lows of the past year?
- Is your business seasonal? If so, is it performing as you expected?
What Actions to Take
If gross revenue is increasing, make sure margins on new business are on target.
- Forecast how long you can handle the increase with existing employees and when you need to hire.
If gross revenue is shrinking, decide if it is a new reality or temporary.
- If it’s a new normal, what cuts can you make to adjust for the lower revenue without destroying the culture?
- If temporary, how long can you afford to support the current cost structure?
- Shift all available people and resources to lead generation, proposal generation, or other sales activities.
Read More: How Much Do Bookkeeping Services for Small Businesses Cost?
Labor Cost per Employee
Total Labor Cost ÷ Number of FTEs
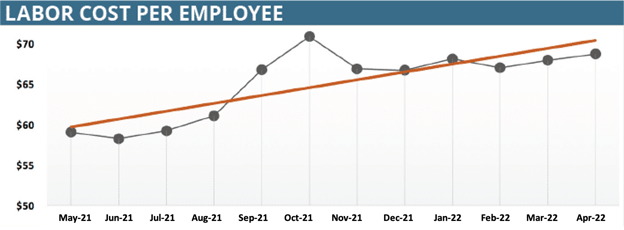
"Labor cost per employee provides a benchmark on how your total costs for human capital changes as you grow."
What Does It Tell Me?
Labor cost per employee is the total cost of your labor divided by the number of full-time equivalent (FTE) employees. Full-time salaried employees are equal to one FTE at 40 hours of work.
This dollar figure shows changes in cost per employee and gives visibility into hidden costs like overtime, health insurance, PTO, etc. Profitable companies that share profits want an increase in cost per FTE. That may also mean low turnover as higher-paid, more experienced people have higher billing rates. Higher profits drive bonuses which increase the cost per FTE. In this case, higher trending costs can be a good thing.
What Should I Look at?
- Is your labor cost per employee increasing, decreasing, or static?
- How does it compare with your revenue per employee?
- Are the changes a trend or an anomaly?
What Actions to Take
- If labor cost per employee is increasing, is revenue per employee increasing at an equal or greater rate? Is this trend moving in the right direction? If not, take a look at your employee comp and bonus structure. Do any compensation policies seem out of whack or overly generous?
- Analyze pricing to ensure you are keeping up with increasing costs. Most cash flow problems come from low gross profit, which means not including all of the costs to provide a service.
- If your labor cost per employee is going down, evaluate if that’s good or bad. Reducing overtime or hiring lower-wage staff are often the easiest ways. Study how that affects the business model.
Gross Profit % (Gross Margins)
Gross Profit ÷ Total Revenue x 100
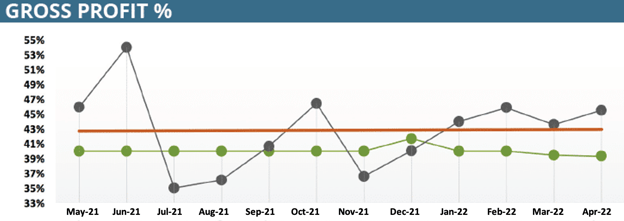
"Gross profit % or gross margins vary with industries and company lifecycle. Do you know where your profit metrics and trends should be?"
What Does It Tell Me?
Gross profit, aka Gross Margin, shows how efficient the business is, as it delivers your services. Your gross profit percentage tells you what portion of your earnings are available to cover:
- Overhead
- Taxes
- Net profit targets
Gross profit is shown as a percentage to help make sure increases in revenue don’t mask service delivery problems.
Gross profit % shows how much profit was made on the work provided, as a percentage of the total revenue. It tells you how well you priced your jobs, managed people, and controlled out-of-pocket expenses.
Use your gross profit % to evaluate how well you are managing sales and service operations. Is your sales department delivering profitable projects? Are your project managers completing the projects within budget?
What Should I Look at?
- How does the gross profit % compare to your targets? How do your gross margins compare to that of your competition?
- Which clients, teams, salespeople, and lead sources produce the highest gross profit %?
What Actions to Take
- Use unit economics to drill down your metrics to gross profit % by client, project, or team to understand which clients, types of projects, and teams generate the most profits.
- Review the lowest margin clients on each team to understand real costs and the associated value to clients. Update your pricing model to reflect the true cost and your full value. Moving from hourly billing to value pricing is usually the single biggest way to drive profits.
- Recognize and reward those who deliver the highest gross profit. Recognition at home often has the longest impact with minimal cost. Turn your best performers into trainers and incentivize them to increase the company's gross profit.
- Before you add any new service staff, decide if you should fire low-margin clients and replace them with higher-margin clients. Addition by subtraction is a great way to drive more profit without increasing staff costs. This also delays the inherent risk of adding new fixed salary costs. Firing bad clients also helps employee retention, as low-gross clients usually cause grief for you and your staff.
Read More: How Do I Know If My Business Needs A Financial Controller?
ROI on Total Labor Cost
Net Income ÷ Total Labor Cost
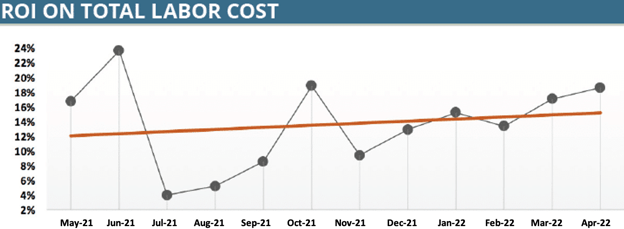
"ROI on total labor cost shows you how much profit you get from your investment in your people over time.
If you take care of your people, they will take care of your clients, who will take care of your investors."
What Does It Tell Me?
ROI on total labor cost is the % of net income compared to the total human capital cost. It shows the profit on the investment in your people – the profit earned on the total cost of your staff.
ROI on total labor cost shows you how effectively you manage your most important asset, your people. It shows the effectiveness of your human capital management strategy. The trend shows your ROI on your people over time and whether you need to focus more on your company or people strategy.
What Should I Look at?
- ROI on total labor costs compares the changes in your payroll costs with the changes in your net income. Look for changes in the trend. These shifts will tell you if you need to focus more on your people or your finances.
- Investigate which of the above trends caused the change in the profit per person.
What Actions to Take
- If the ROI on total labor cost is trending up, then it is a result of your revenue going up faster than your payroll costs. This means it's time to recognize and reward your key performers.
- If it’s trending down, you want to look at the effectiveness of your human capital management strategy. Look for areas for improvement including more effective recruiting, employee onboarding, training, and incentivization to lower turnover.
- Evaluate your drivers of net income and labor costs to understand changes. Which are your most profitable teams and individual employees?
- Implement human capital management strategies to increase productivity and profitability. Review your human capital strategy and make sure it is updated to reflect the company’s current needs.
Read More: Outsourcing vs. In-House Accounting Cost Comparison
Net Income
Revenue Minus Cost of Goods Sold Minus Overhead
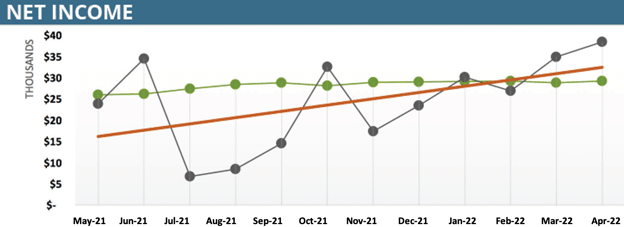
"Net income is the bottom line, a key indicator of profitability, cash, and equity."
What Does It Tell Me?
Net income is the most important result of the company. It is the amount of profit or loss the company made. Net income is also referred to as the bottom line.
Net income shows whether or not the company increases its equity value by bringing in more money than it spends each month. It tells you if the business model is working, and it is important to measure profitability over time.
Net income turns into cash, supplying the lifeblood of the company.
What Should I Look at?
- What does the orange trend line tell you? Is your net income directionally going up, down, or shrinking?
- How do profits compare to what you thought they were going to be (your budget)?
- Check your net income against previous months. Has it changed? If so, how?
- After studying gross profit, now understand your overhead and how that impacts your net profit.
What Actions to Take
Did you expect the changes in net income reflected in your financial report? If not, analyze the variances.
How does your net income trend compare to the gross revenue trend:
- If gross revenue is growing, review if you have to add overhead (e.g. space).
- If gross revenue is flat or shrinking, decide if the trend is permanent or temporary.
- See if you can increase profits by outsourcing in order to reduce overhead costs.
- Identify manual processes that can be automated.
- Implement back-office efficiencies to reduce time spent on non-revenue generating activities.
- Communicate your net income targets to key managers and staff to align their rewards with company profits and get discretionary effort.
- If temporary, forecast how long can you afford to continue operating with your current cost structure
Struggling with your cash flow in these economic conditions?

Could Your Business Benefit from a One-Page Scorecard Like This?
We'd be happy to speak with you about how your company can benefit from monthly financial insights and management with a One-Page Scorecard like this. Having easy-to-scan charts that show your company's relationship between people and profitability can provide valuable insights that you might not currently have on your business.
GrowthForce specializes in providing accurate and up-to-date bookkeeping, accounting, and controller services for small and medium businesses. We produce both financial and management reports that show businesses their key performance indicators to help drive growth and success.