.png?width=563&height=144&name=New%20GF%20Logo%20(37).png "New GF Logo (37)")
.jpeg?width=800&height=533&name=AdobeStock_540220337%20(1).jpeg)
If you're not aware of your company's financial trends and how profoundly the loss of key performers can affect the numbers, you may find your business is in a cash flow crunch you could have avoided.
Knowing your company’s circumstances is crucial to flesh out the story depicted on your Company Scorecard. This blog walks you through how to read a Company Scorecard.
The Acme Company Scorecard used as the example for this blog illustrates what happens when a company loses key people and hires new replacements who are scrambling to gain momentum, learn the product and find their stride; while the CEO is focused on meeting budgeted revenue goals, gross profit margins and net income.

3 Steps to Analyze Any Financial Report
There are 3 steps to analyzing any financial report and the same holds true for the Company Scorecard:
- Observe what is happening? Comparing performance over time can be very helpful. Note if there are favorable or unfavorable trends occurring. Clearly identify what is happening and its significance to your business.
- Investigate why you’re seeing the trends you are, and whether seasonality or an outside cause is affecting your results. Has a new competitor entered the market? On a macro-level what’s happening in the industries you serve? A business owner must keep abreast of the internal as well as external factors affecting financial performance.
- Respond appropriately to what’s happening whether the identified cause is providing good or detrimental results. In this way, you are less likely to miss opportunities or be blind-sided by emerging difficulties.
What can you See?
Let’s define what you see on the Company Scorecard.
| On the LEFT SIDE, you see Gross Revenue, Gross Profit and Net Income charted over the past year month by month. | On the RIGHT SIDE, are the same drivers but charted using the sales totals for the last or Trailing Twelve Months (TTM). |
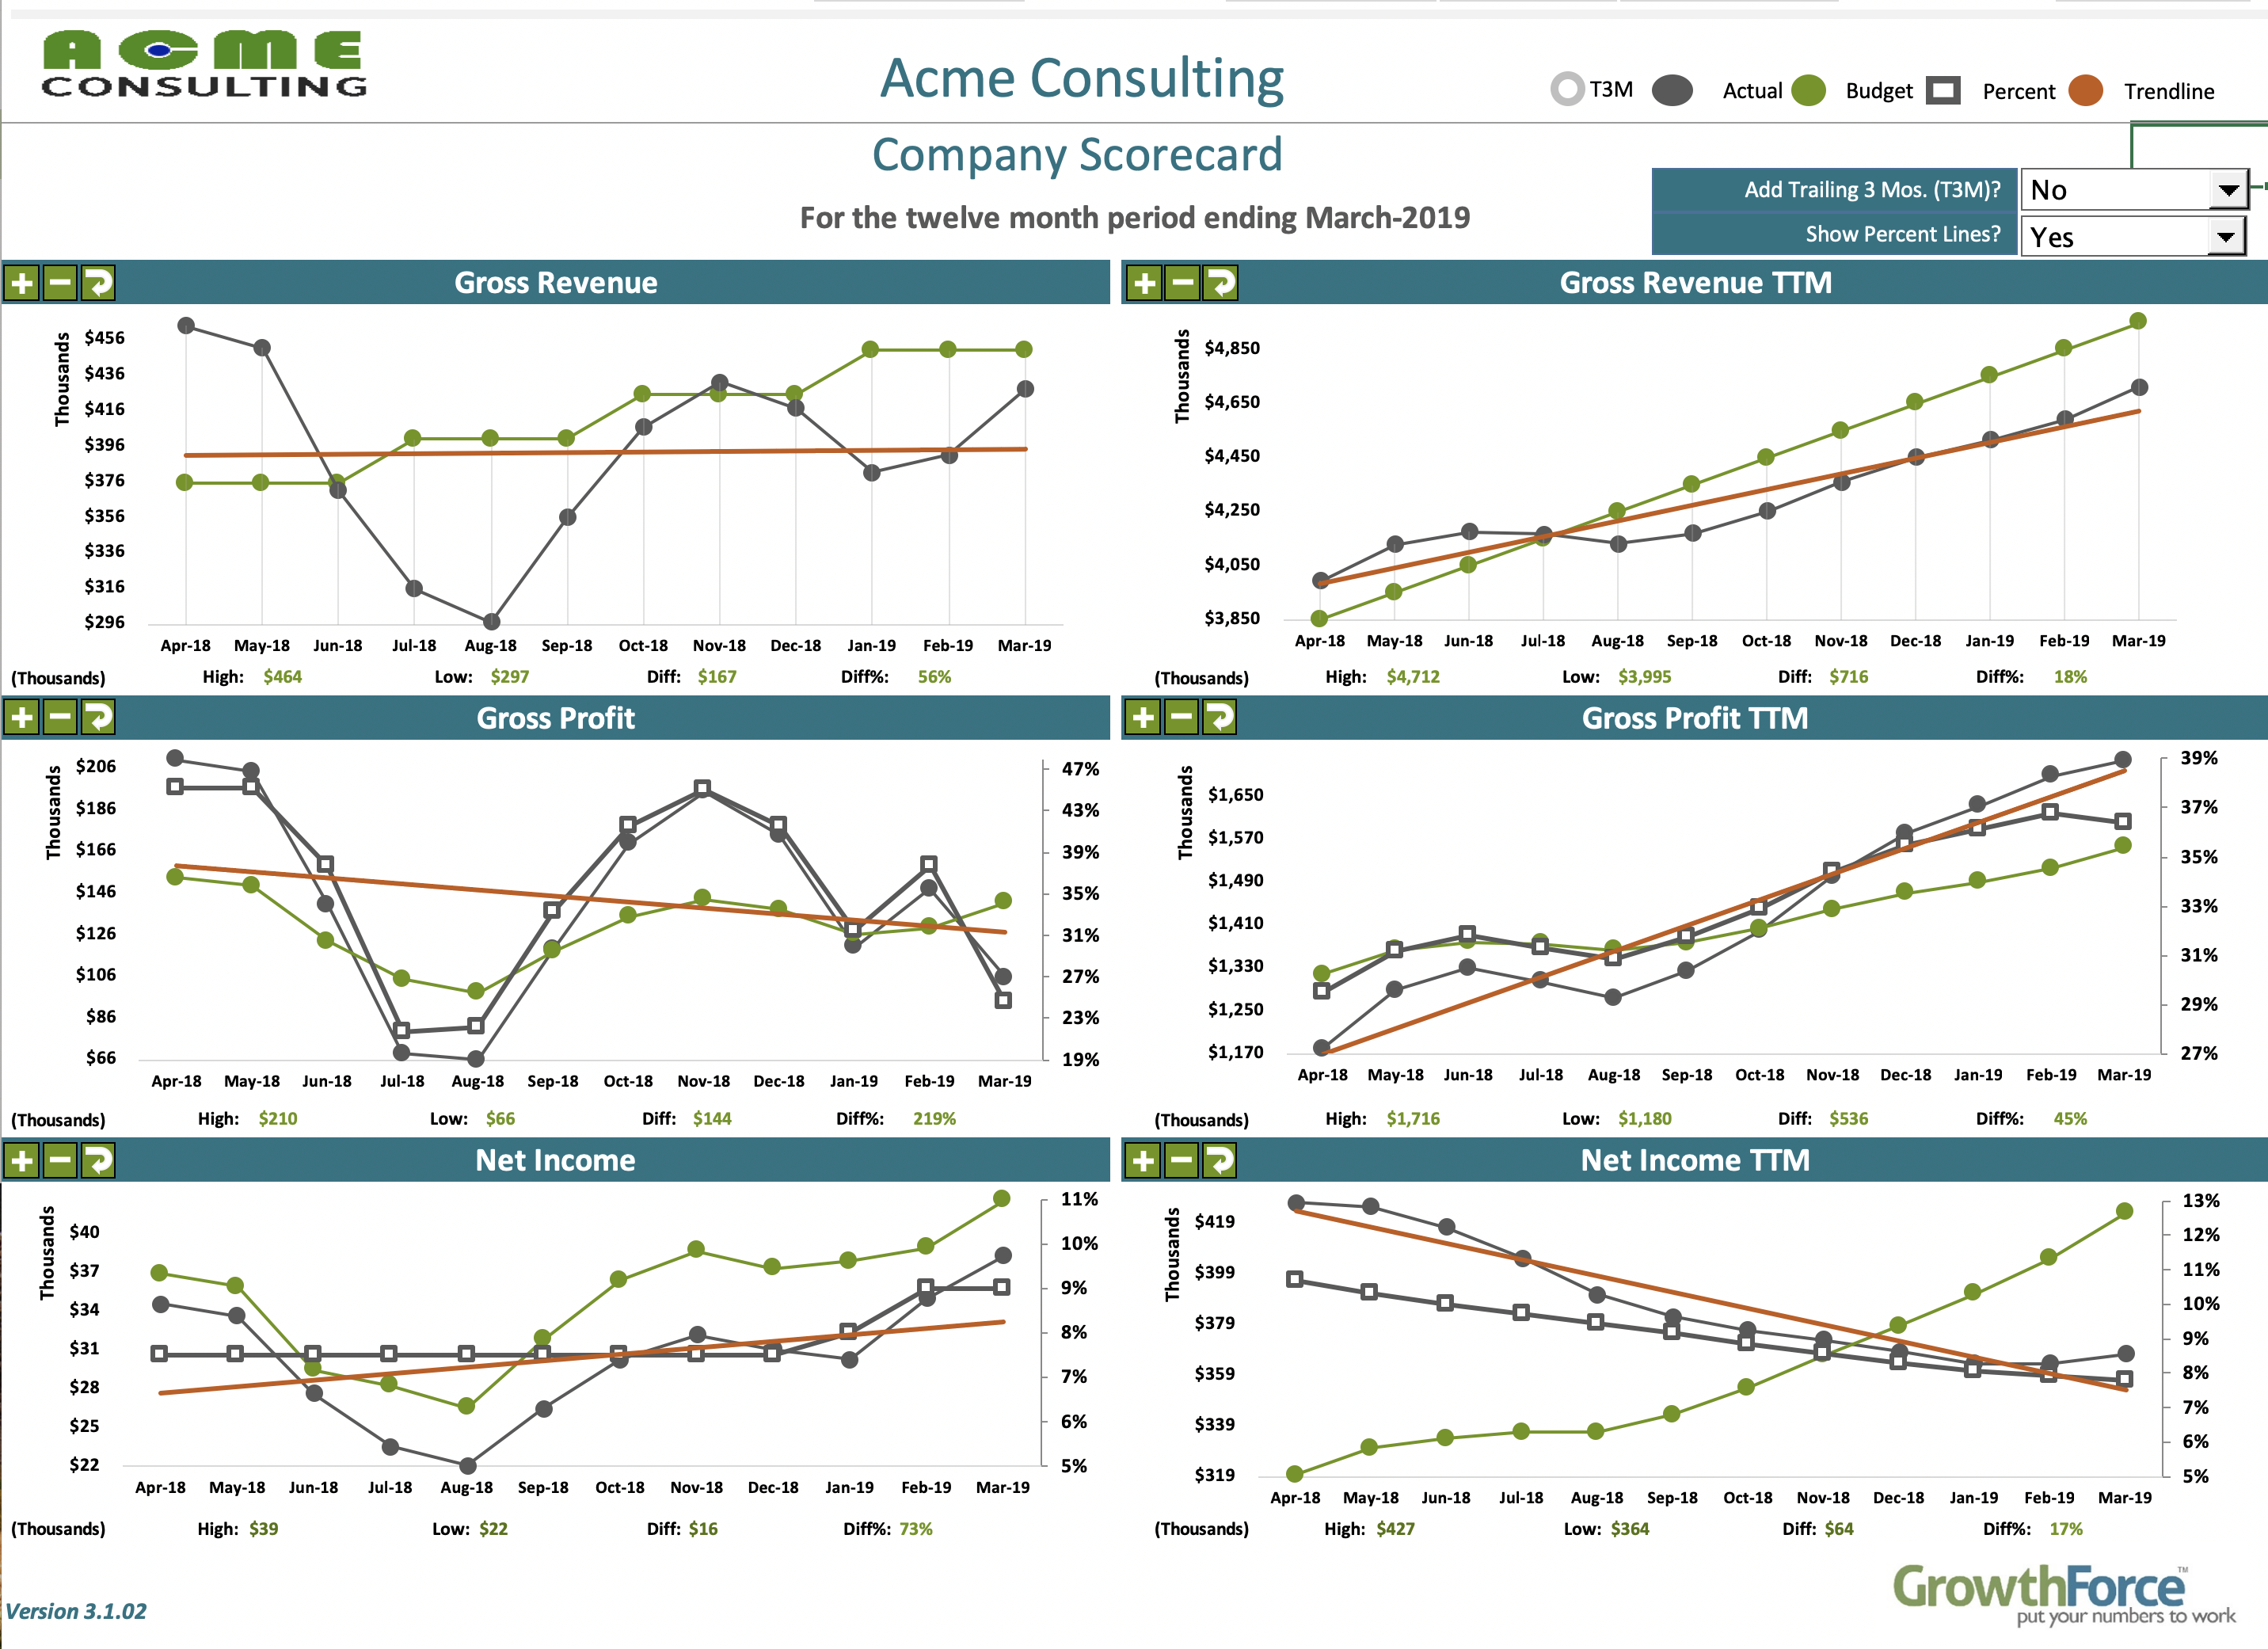
To illustrate, on the right side under Gross Revenue TTM - the $3,850M TTM for April 2018, equals the sum of the total sales from May 2017 through April 2018.
Each consecutive monthly TTM drops off the oldest month from the total and adds the most recent month.
What the TTM achieves is a smoothing out of seasonal variations and a clearer picture regarding revenue, gross profit, and net income trends.
Looking at both the monthly totals and monthly TTM totals side by side, provide insights into recent TTM trends, as well as, the monthly blips that can affect the big picture; if considered alone, could lead to distortions in your financial analysis.
Gross Revenue
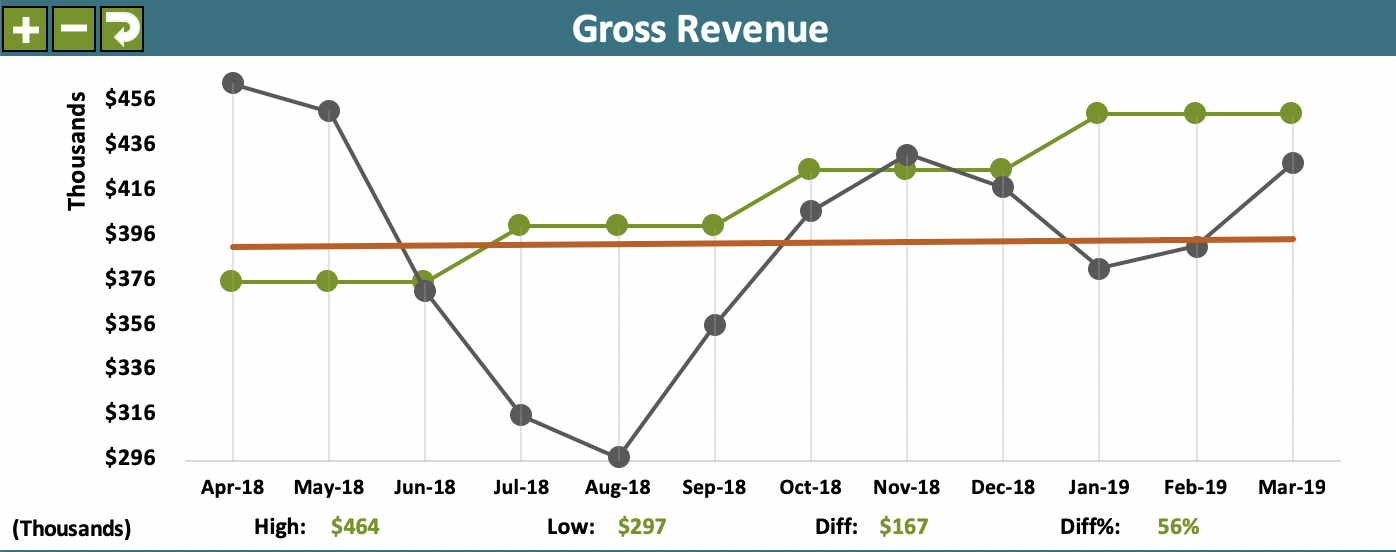
Notice the black line Actuals data points swing wildly during April through November. What might have caused this 35% dip in revenue during that period? Could it have been avoided?
It turns out this company had lost a key salesperson and had to quickly find a replacement who then took several months to regain the lost sales momentum.
What’s a CEO to do in this case?
- Understand why you may have lost your employee. Could it have been avoided? Were they disgruntled? Typically, it takes 8-12 weeks to replace a knowledge worker and another few months for the new employee to become fully productive. It pays to keep your employees happy and motivated so determine if there was a cause that can be addressed.
- Make sure your training and onboarding routines are current and effective, so the new staff member is given the tools to become successful, and provide realistic sales goals they can meet in a short period of time, helping to build confidence and momentum more quickly. Gaining full productivity in a reasonable time frame is important.
Gross Revenue TTM
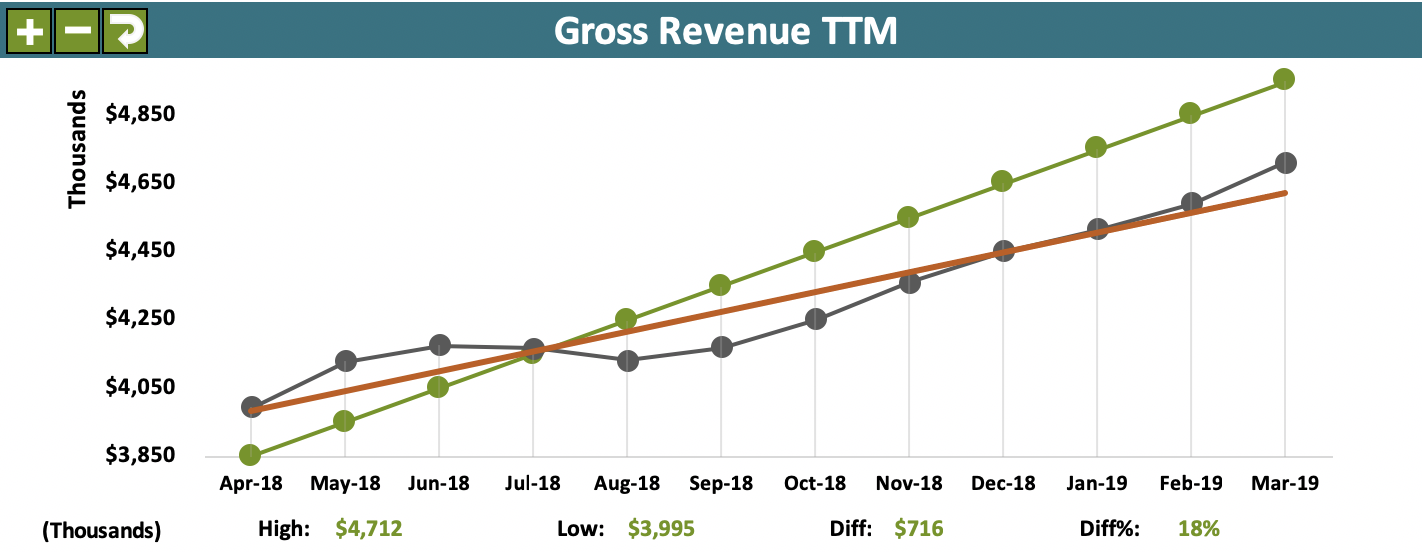
The good news in this scorecard is the orange trend line for Gross Revenue, sloping upwards, and the black Actuals line from February to March is turning gently upward as well. There’s a positive revenue trend overall, however the actuals have fallen away from the budgeted amounts since August.
What’s a CEO to do?
Since Actual results are below plan - Increase revenues with targeted marketing to existing customers. Earning existing customers' business is much cheaper, less time-consuming, and more likely to close than acquiring new customers.
Gross Profit $
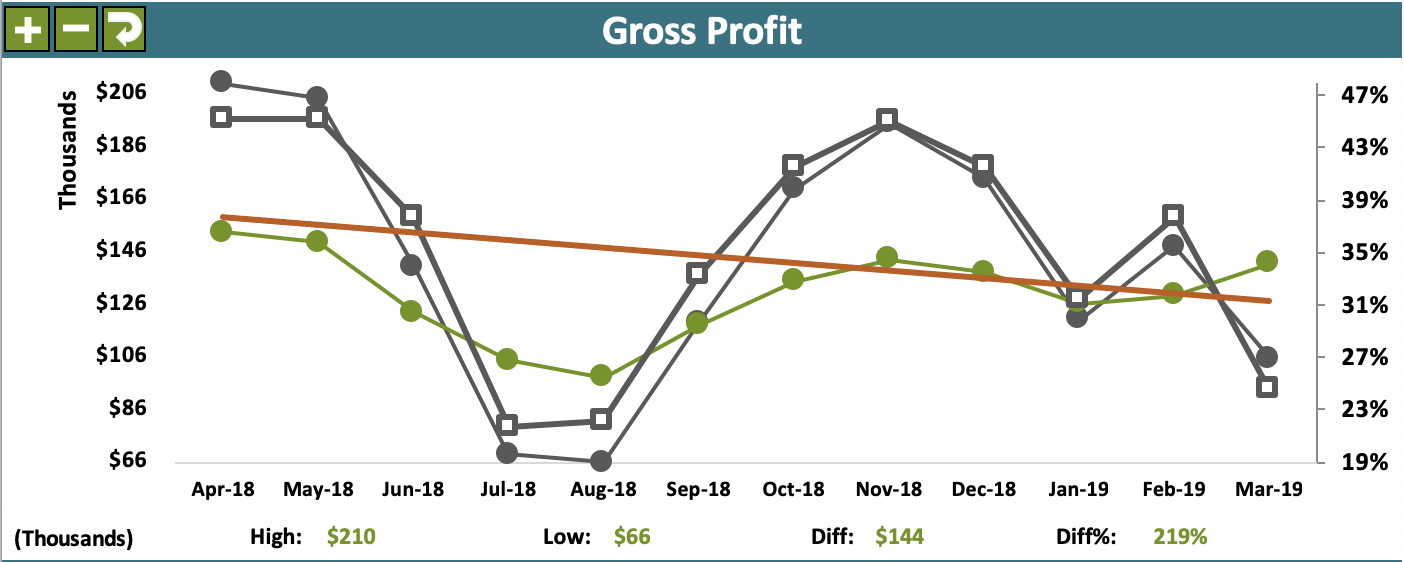
Gross Profit is your Revenue minus your Cost of Goods Sold (COGS). COGS is the direct expenses you incur that are directly related to earning the income. There are only two types of direct expenses: direct labor and direct material.
You can see by the budgeted gross profit dollars, compared to actual gross profit dollars, that there was an expectation of lower gross profit due to the loss of a key employee, however, the expectations were somewhat unrealistic.
Additionally, what is alarming to see is the downward sloping orange trend line from April 2018 to March 2019. This unfavorable trend warrants further and immediate investigation.
You know sales volume has dropped due to the loss of a key employee, however, why is profit declining from a high of 47% to 27%? This is worthy of the CEO’s close attention.
What’s a CEO to do?
Review your pricing and job costing. Is pricing correct? Are you being as efficient in delivering our products and/or services as you could be? Do you need to re-negotiate prices with our vendors? Are you accounting for all your direct and indirect costs in your estimates?
Gross Profit $ TTM
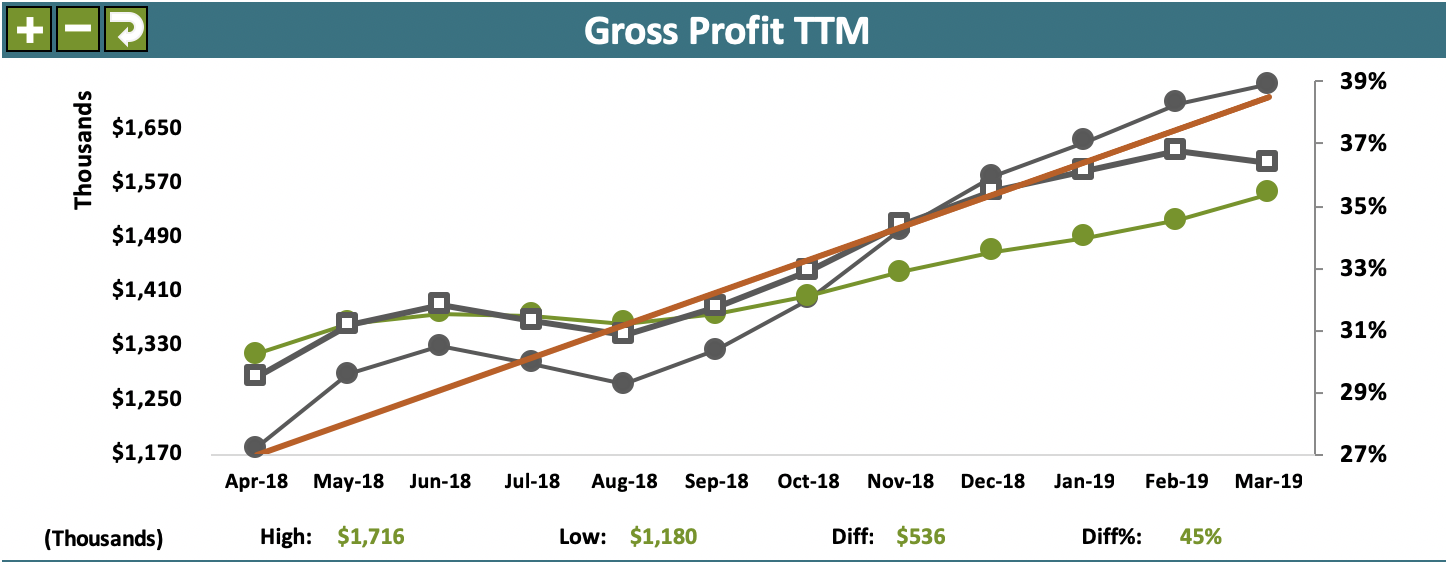
The Gross Profit TTM paints a completely different picture, one much more positive than the month-to-month gross profit $. Here you see a nicely upwards sloping Gross Profit TTM trend line (orange line) with only a slight downtick on the actuals Gross Profit TTM (black line).
Even though the Gross Profit TTM looks favorable and exceeds the budgeted amounts (green line), there is still cause for concern as the actual Gross Profit TTM is beginning to respond negatively to the most recent gross profit $ performance levels.
What’s a CEO to do?
Compare the most recent month-to-month totals to the TTM totals. This is helpful because it predicts the direction the company may be heading if you stay the course.
Net Income
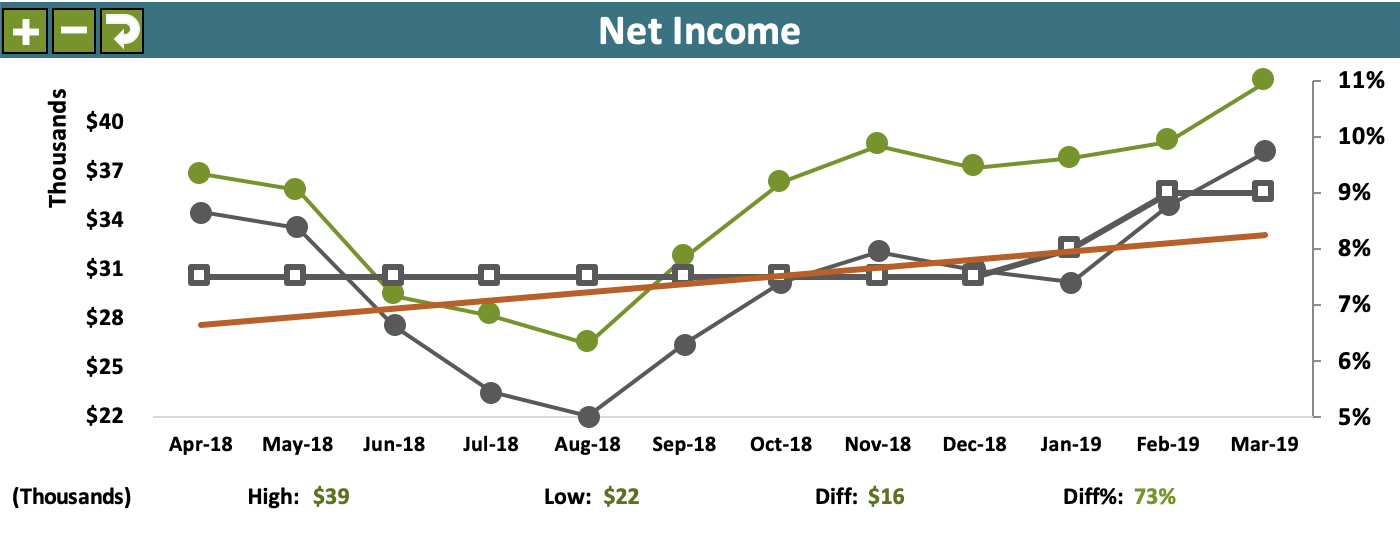
Net Income is your bottom line. It is what’s leftover after your overhead, your sales and general/administrative expenses are subtracted from your gross profit.
When gross profit is good but net income is lower than anticipated it indicates that your gross margins are not sufficient to cover the costs to keep the doors open and provide an adequate return on investment. This may call for revisiting your pricing structure and/or implementing a cost reduction initiative.
What’s a CEO to do?
Monitor trends monthly. On the Acme Net Income month-to-month chart you see the (orange) trendline rising by about 1.25% during the year, however, the actual results are lower than the budgeted expectations. This should prompt digging deeper into why you are exceeding your budgeted numbers. It may be something that can be corrected relatively easily, or if the higher expenses were a one-off occurrence, you can anticipate tightening the belt in the foreseeable future to offset the higher cash outflows. Either way, it is much better to monitor trends on a monthly basis rather than find yourself scrambling to make payroll because you weren’t paying attention.
Net Income TTM
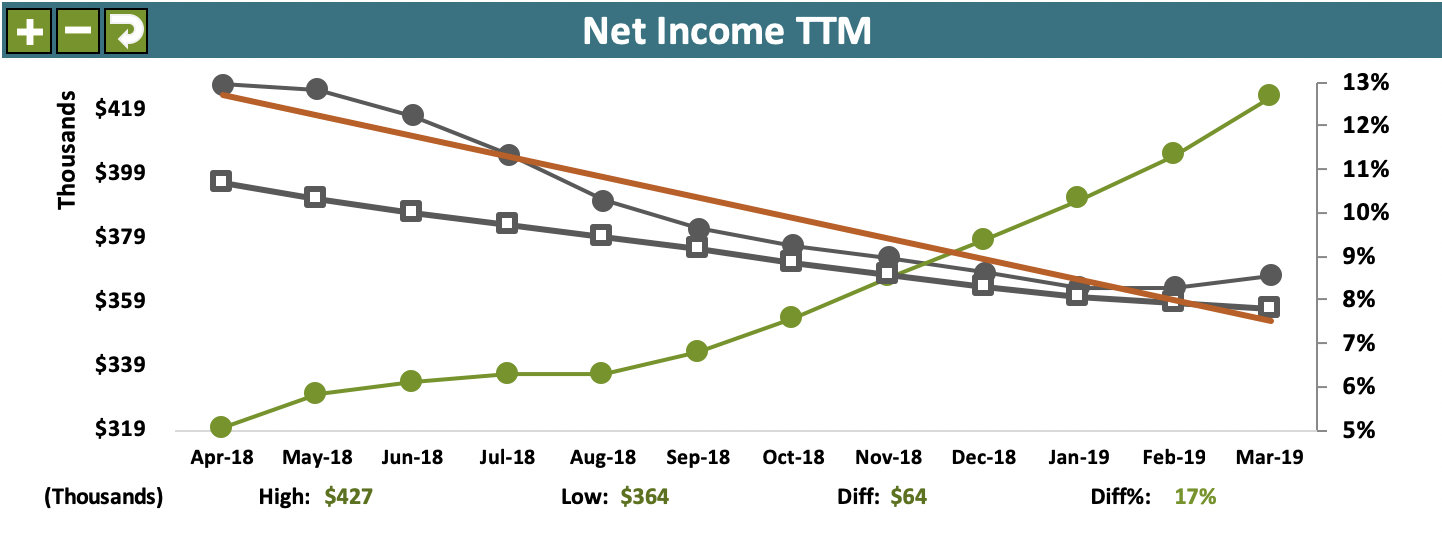
Net Income TTM corroborates a similar story, however, it’s important to note that from February to March 2019 there is an uptick in net income by about .5%, indicative of cost-saving initiatives implemented in January 2019 that are beginning to take effect.
This is good news, but it's important to look more closely at the many factors that may be hampering revenue growth, gross profit margins, and bottom-line results.
Monitoring these metrics on a monthly basis can keep a CEO or business owner informed and focused on the many factors driving financial performance.
The GrowthForce Company Scorecard template is a simple tool designed to help busy CEOs keep a pulse on the financial health of their business and push the right levers to increase top line and bottom-line results.